

Agree the question first
We connect each piece of analysis to a decision and the person responsible for it. That keeps the scope manageable and makes it easier to decide which data is essential, which can wait and what a useful answer would change.

A Sydney retailer sees advertising revenue rise while the weekly sales meeting gets harder. Returns are climbing, repeat purchases are uneven and nobody agrees which total belongs in the budget discussion. Adding another chart will not settle that question. The revenue figures need shared definitions and traceable business records.
Markezo helps teams make sense of data spread across advertising accounts, website reports, CRM systems and online stores. We start with the decision you need to make. It might be choosing which product range to promote, understanding why enquiries stall or deciding whether a campaign deserves more investment.
For a business serving both the CBD and surrounding suburbs, the comparison also needs context. An online order, an in-store sale and a corporate account can have different buying cycles. Combining them without those distinctions can hide the customers and activities that support the business.
Data analytics work brings those differences into view. We review the available data sources, agree the measures and check a sample of records before designing the report. Where data is missing, we explain how that limits the conclusion.
The next step might be a cleaner sales view, a question worth testing or a reporting task that can be simplified. The aim is to help your team use numbers in a decision, with enough detail to challenge them when something looks wrong.

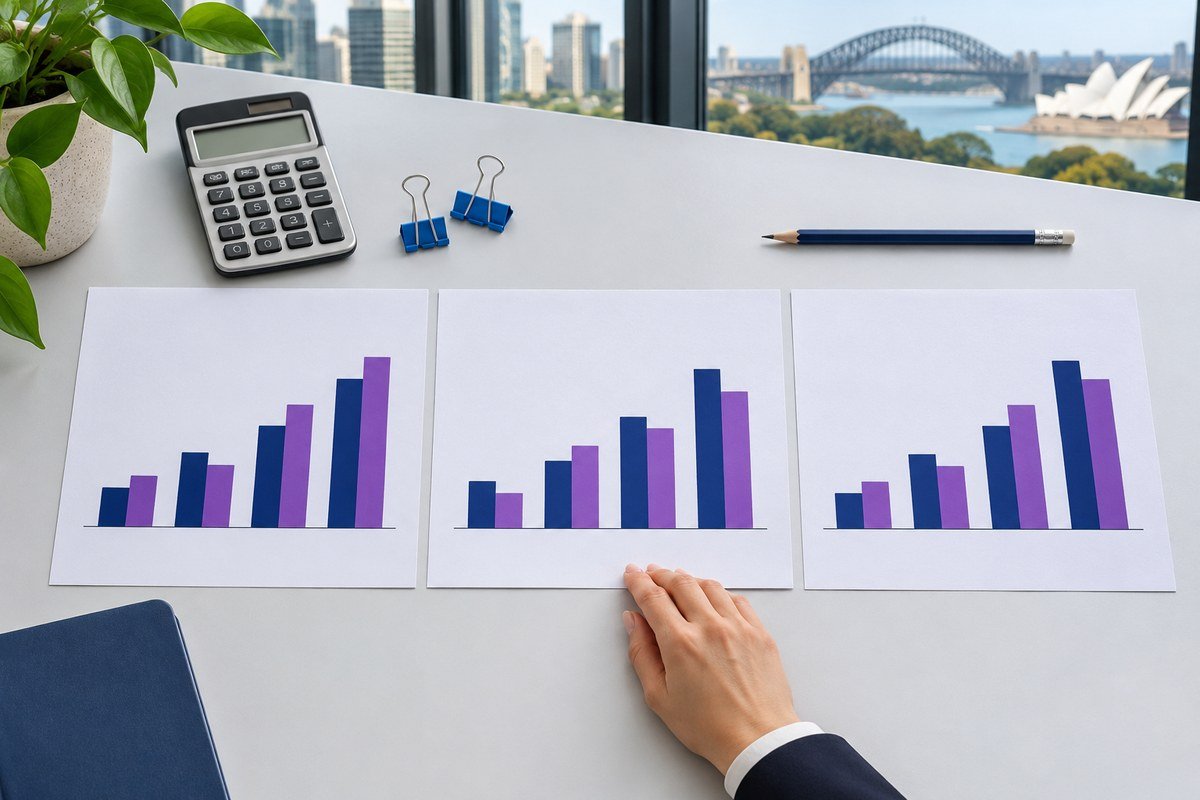
Sydney
Two totals can both be correct and still be unsuitable for comparison. A store might record an order when it is placed, while another report recognises it after dispatch. Refunds may arrive weeks later. We establish which business question each figure answers, then decide how to bring the sources together. A dashboard becomes useful when people can see what changed, understand what is included and investigate further before moving a budget.
For Sydney businesses considering best data analytics services sydney or data analytics services services sydney, we review data quality, attribution and reporting that supports decisions before recommending a practical campaign or improvement plan. The proposed approach reflects the customer needs and competitive conditions of the target service area.
Start with a manageable slice
Rather than connect every system at once, we choose a question with a clear owner. For example, a Sydney homewares business may want to compare first orders with repeat purchases. We identify the relevant customer and order fields, check the available history and agree how cancelled orders will be treated. A small sample often reveals mismatched dates or identifiers before they affect a larger analysis.
Keep the measures consistent
The same word can describe different things across teams. Revenue may include delivery charges in one export and exclude them in another. We document the calculation, reporting period and exclusions beside the measure. Reconciliation checks compare the result with the agreed source, while unmatched records remain visible for review. This helps the team understand the size of a gap instead of quietly losing it in a combined total.
Read the journey in stages
Website activity explains what people did before enquiring or buying. Sales records show what happened afterwards. Where the information supports a connection, funnel analysis can reveal whether the problem sits in attracting suitable visitors, completing a form or following up an enquiry. That finding can inform a landing page, the structure of service content or a sales process. It also gives marketing and operations a shared question to investigate.
Make local comparisons useful
A Sydney team comparing branches needs consistent periods and definitions, with changes in trading hours, stock or service capacity taken into account. A larger sales total alone does not explain stronger demand. We can separate customer groups or product categories to see whether the difference persists. These comparisons are illustrative starting points; the available data determines what can actually be measured.
Put the findings to work
Agree a regular review date. Reports should support a recurring conversation. We organise the view around the decisions each person makes, highlight meaningful changes and record the proposed action. Forecasting can help explore assumptions where sufficient history exists, but the assumptions stay visible. When a source changes, we update its notes and checks so the next comparison still has a sound basis. Explain any uncertainty beside the finding, where the decision maker will see it.
Services






Why Markezo


Next step
FAQs
Related content



Free growth review
Tell us which services you need and we will review the best approach for your business.
 Strategy call available
Ready when you are
Ready to take your business to the next level? Tell us what you are working towards and we will recommend a clear next step.